
This all started with tomatoes. And grew into a Raspberry Pi based whole-house + boiler temperature logging system…
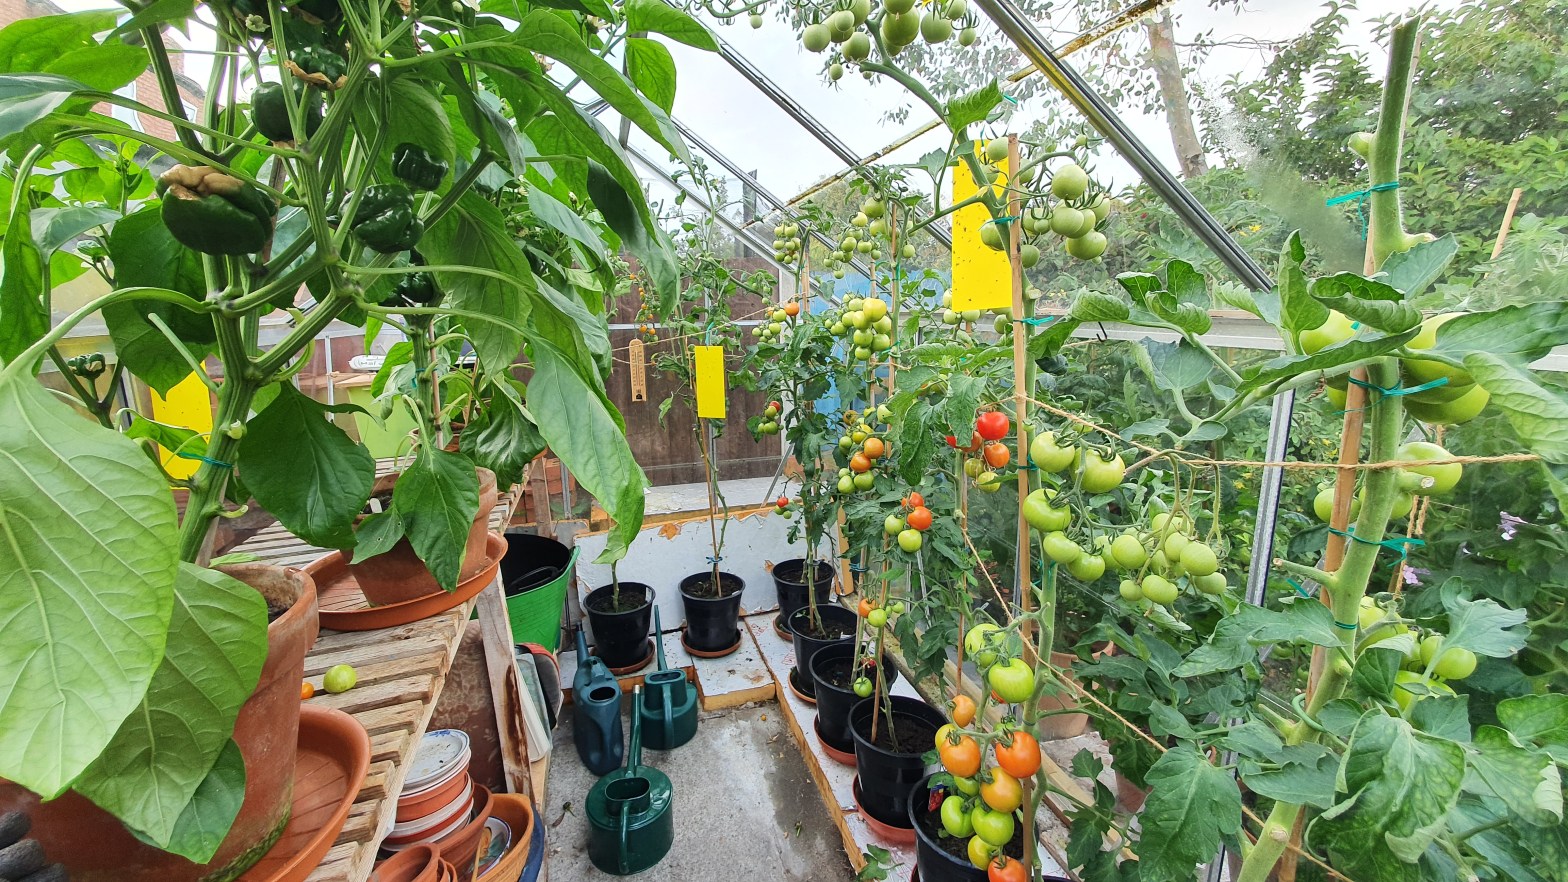
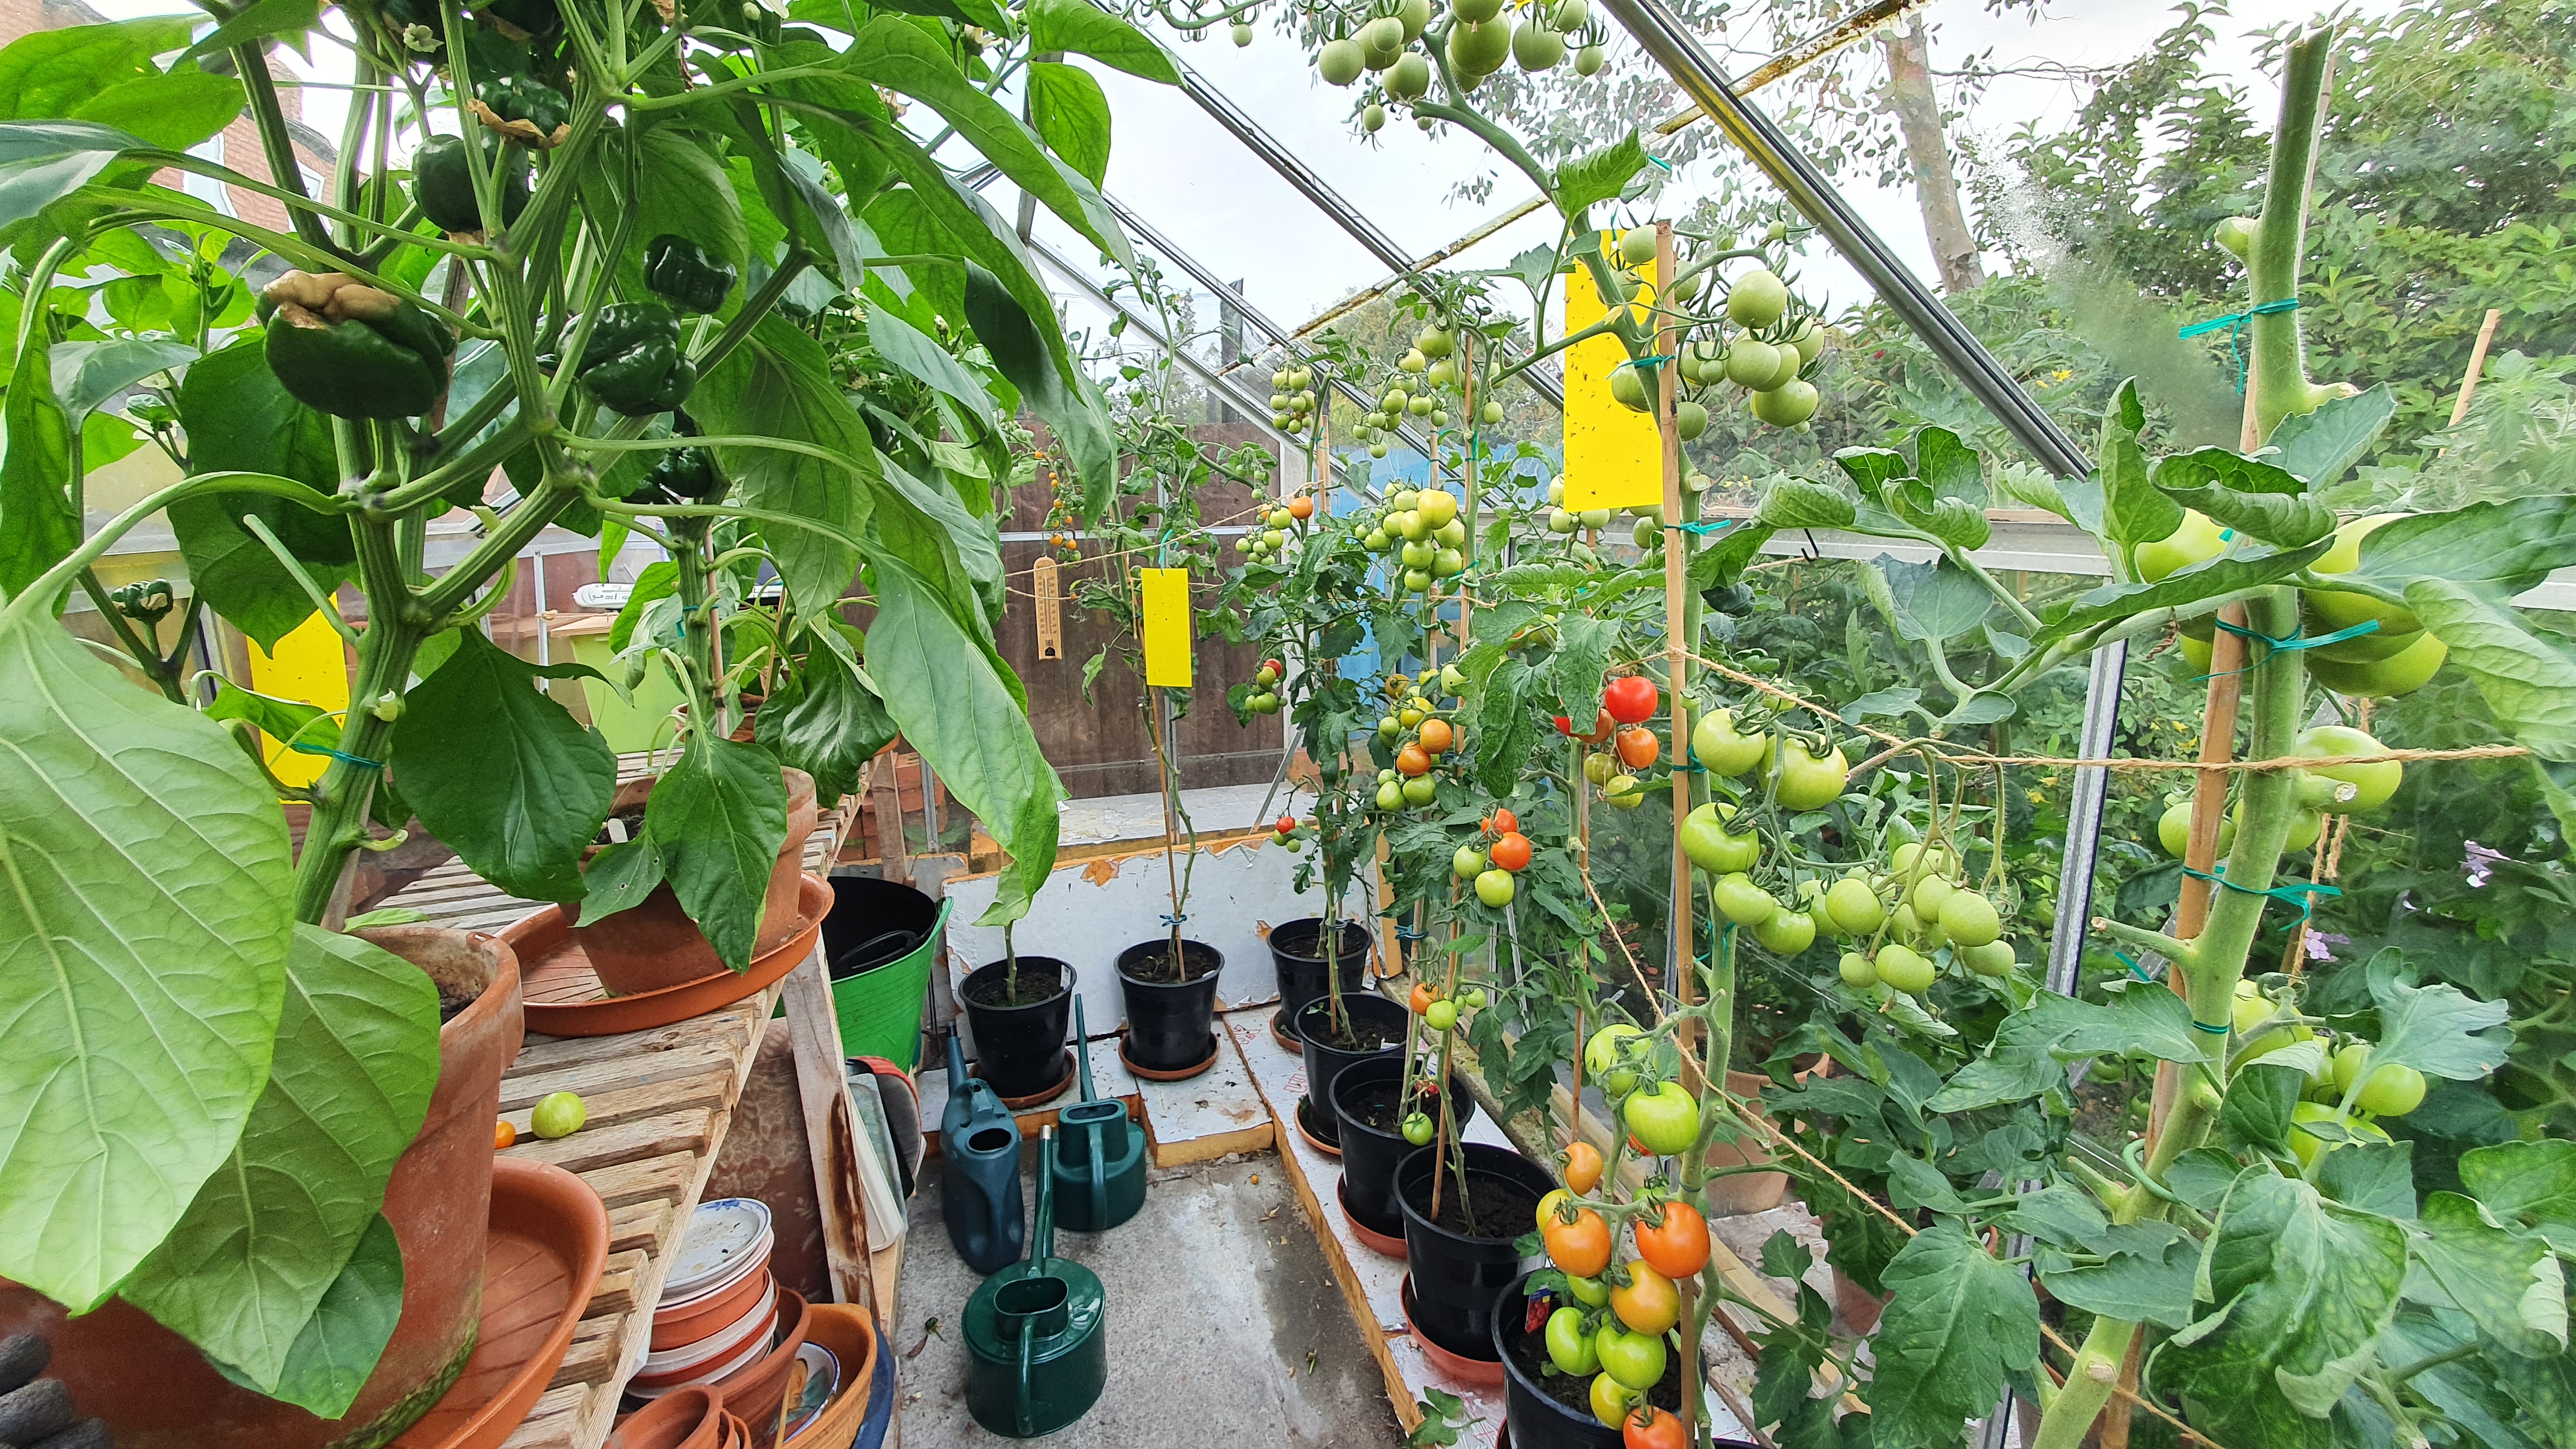
During the 1st UK lockdown of 2020 my elderly parents were shielding and my Mum was looking for things to occupy her time. She started looking online to buy tomato plants/seedlings to grow in her greenhouse – seems like everyone had the same idea as they were in short supply (or maybe she just started looking a bit too soon in the growing season!) – she was buying them in 3’s and 6’s from lots of different sellers on eBay and Amazon. She ended up with way too many, her greenhouse was overflowing and she wanted to give some to me.
This was still early on in the growing season, I don’t have a greenhouse but do have a conservatory. I was worried about putting the plants in there if it was too cold overnight so wanted a way to monitor & log the temperature. I’d been thinking about building some sort of Raspberry Pi temperature monitor for my 20yr-old combi boiler just to check up it was still working OK and so as it turned out the tomato plants were the final thing that spurred me into action.
From this tiny idea I ended up with a total of 7 Pis monitoring 9 temperatures around the house displayed on a dashboard that also shows live electricity consumption data too. Yay.

I already knew that the DS18B20 single-wire temperature sensor was a favourite for this type of project so I ordered a handful from Amazon that were already built into metal probes with long cables. I soldered them along with the required 4k7 resistors onto some 40-pin 0.1″ pitch headers ready to attach to the Pis.
Looking around for software projects that have already done similar I found temperature-machine. I soon grew tired with some of the limitations of this software and eventually discovered Grafana dashboards with Influxdb. Influxdb is a database that’s designed to deal with time-series data (like temperature logging!) and lots of people had already successfully used it for similar applications to what I wanted. I modified existing python I found in other projects to match my setup so that each of my temperature sensor nodes would periodically call a python script to write directly to an influx database on my server node. Grafana dashboards can then be created to process & display the data however you like.
I already head a few spare Raspberry Pis (some model 2B/3B/3B+) that could be made into remote probes and the new-ish Pi 4 4GB I had would be the server.

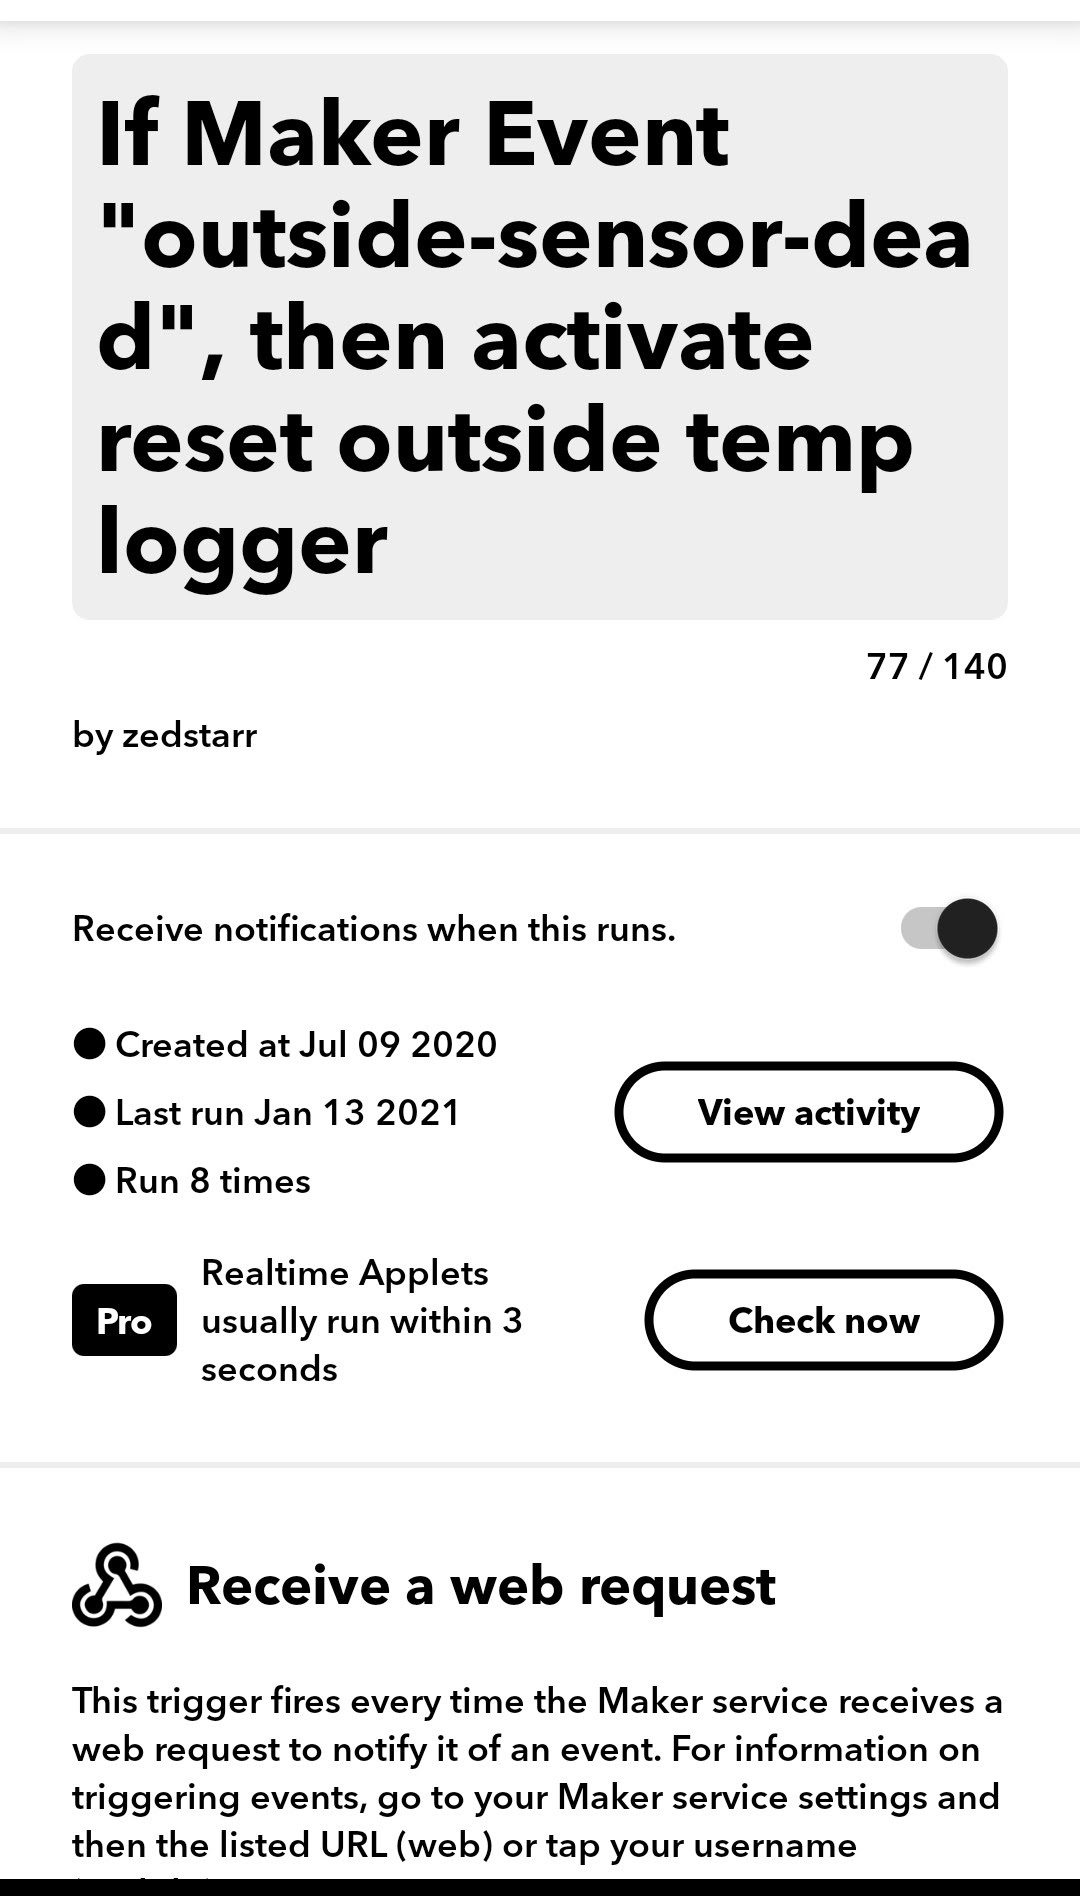
Turns out the cheap DS18B20 sensors I’d bought from Amazon have a nasty habit of locking up, and rebooting the Pi isn’t enough to bring them back to life – the Pi has to be re-powered. Luckily I had a few spare remote control mains switches that knew I could control from IFTTT so I set up a bash script on each Pi to monitor the sensor and when it locks up I call an IFTTT action via the webhooks service then shut-down the Pi. The IFTTT action would call a “scene” on the smart sockets app that would wait 40s (for Pi to shutdown cleanly), turn off the socket, wait 20s then turn the socket back on. A real nasty workaround for some cheap sensors but so far it’s worked like a dream 🙂 I later bought some (much more expensive) DS18B20 sensors from a reputable source but haven’t got round to replacing all the cheapo ones just yet…
I bought a couple of Pi Zero models and one of them was used to monitor the boiler’s central heating and hot water outputs as well as the room temperature, another one was put in the bedroom. I already had a Pi in the cellar next to the broadband router doing PiVPN duty so that had a sensor added too.
I also installed telegraf to collect general performance data on all the Pi sensor nodes as I was curious to see how heavily loaded they were. Telegraf also gave me the opportunity (via a bash script) to query my smart meter/home energy monitoring service and display electricity consumption on the same dashboard as the temperatures.

One of the great benefits of the whole grafana/influx/telegraf system is its flexibility and customisability – it can easily be extended to take in other data sources and types and can also send configurable alerts. I have mine configured to send me a Slack DM + email if any sensors die or of the boiler temps get too high.
How it all looks on my phone:


That’s an impressive project for keeping track of home temperatures.